

Workload Management
Metrics
Get a real-time view of planning activity, project status, team workload, and risk across your execution flow.
Stay in Control WithMetrics That Matter
Book a Demo
Book a Demo
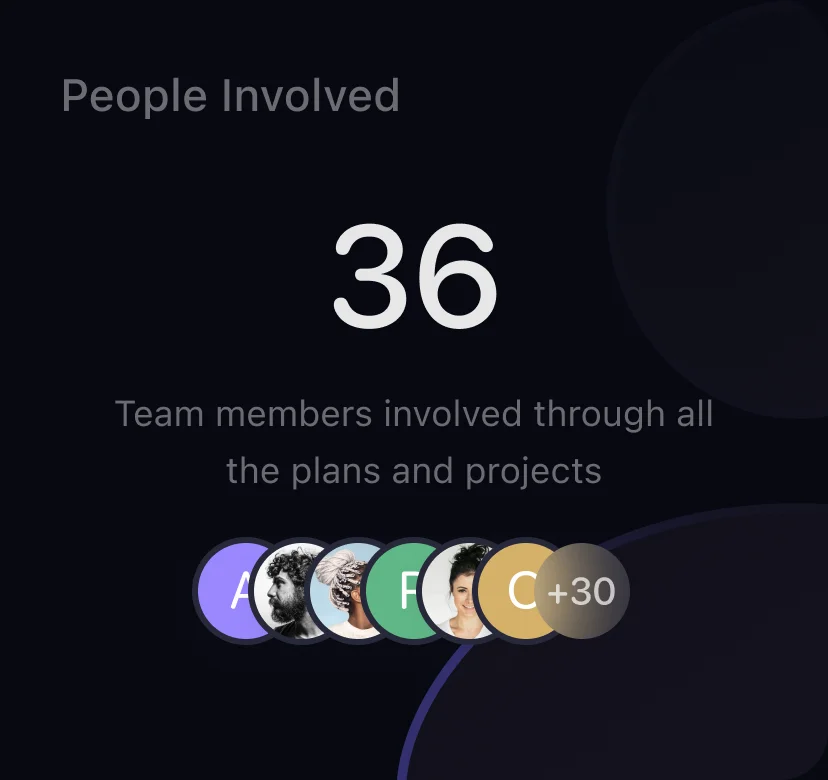
CoreSeenity Workload Management widget showing people involved
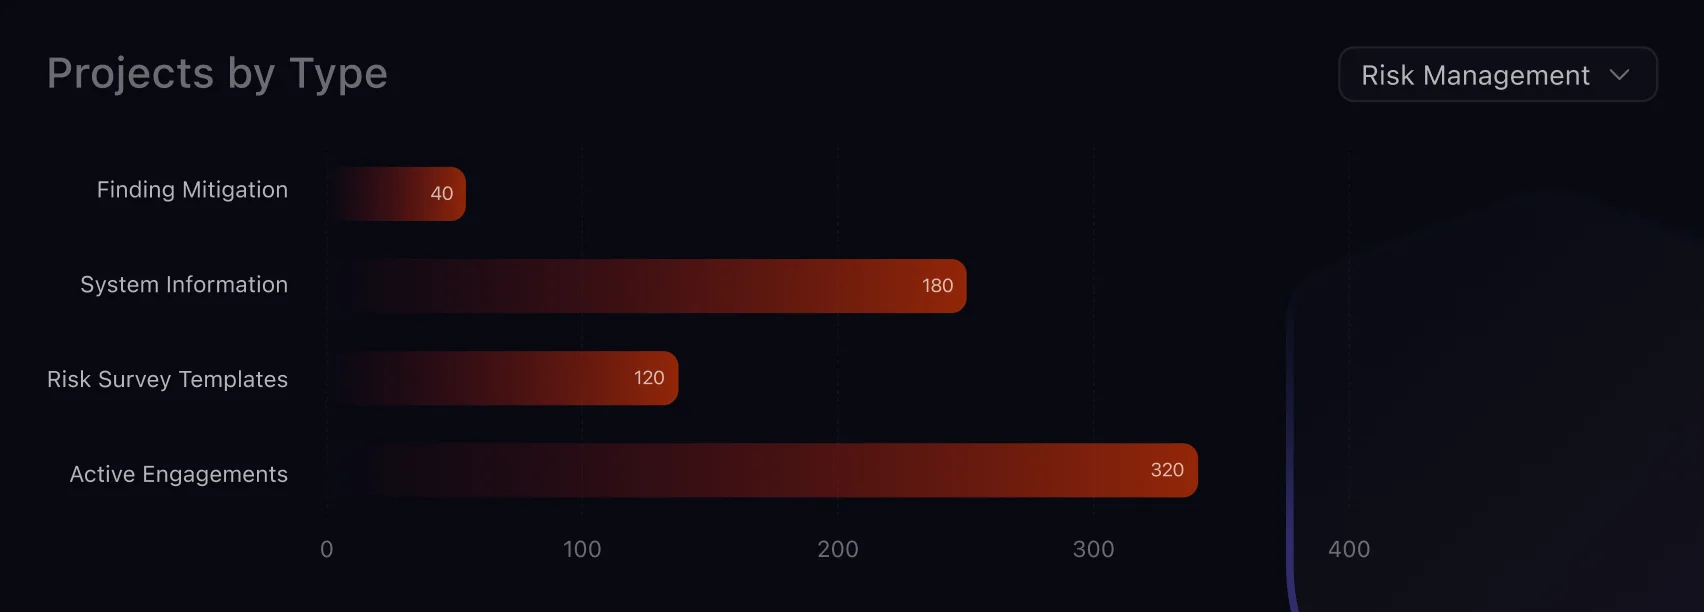
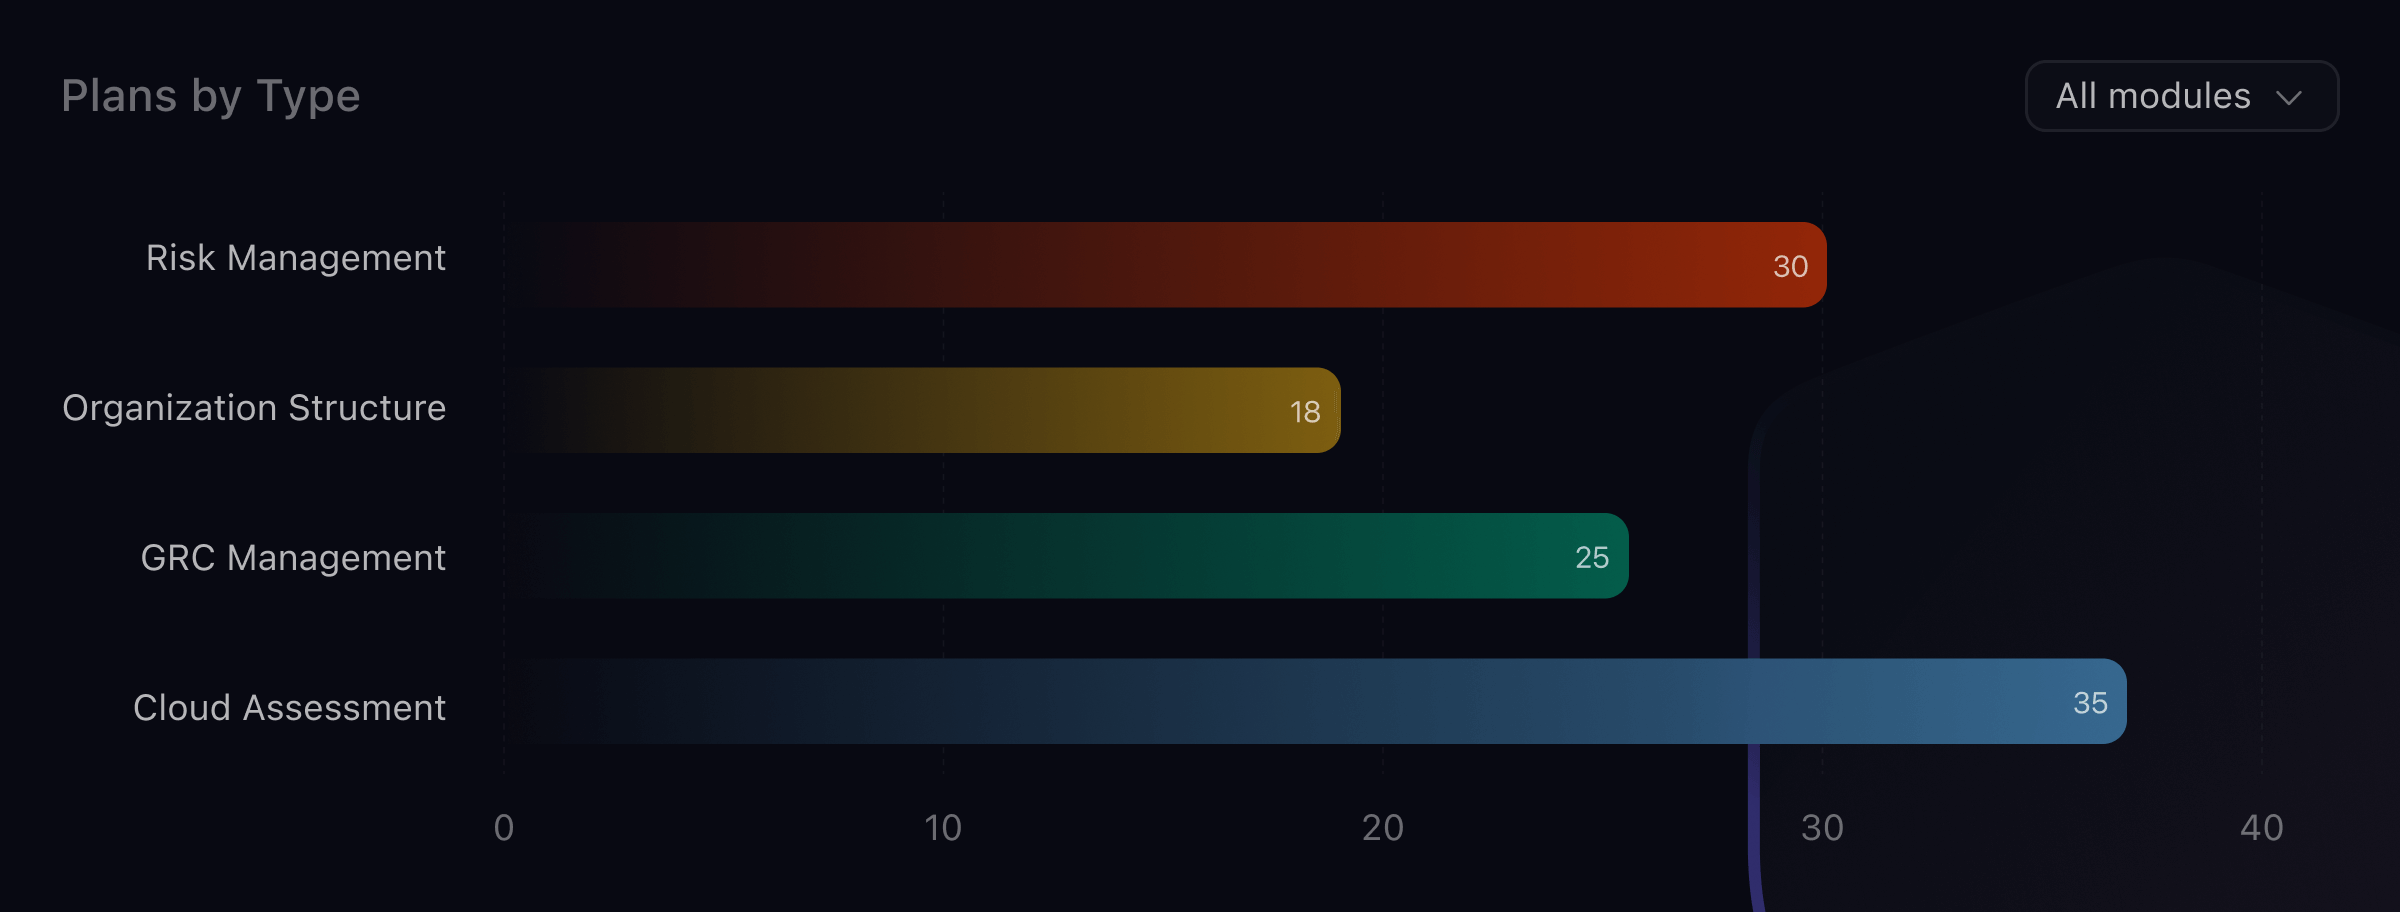
CoreSeenity Workload Management chart of plans by type
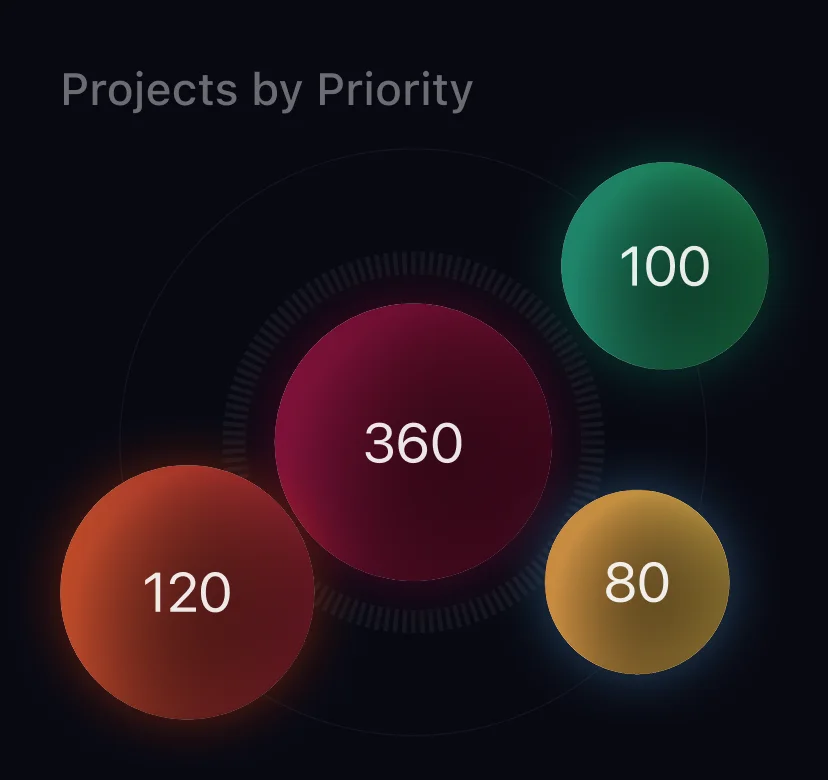
CoreSeenity Workload Management chart of projects by priority
Track the Progress
of Every Plan
Monitor every plan across its full lifecycle - from not started to completed - and act early on the plans that need attention most.
Dashboard showing workload plans grouped by status including Not Started and Require Attention.
Plan Status Overview
See at a glance how many plans are Not Started, In Progress, Require Attention, or Completed - all in one grouped view, so blockers surface early.
Completion rate widget displaying overall progress percentage across workload plans.
Completion Rate
Percentage of overall plan progress calculated from project-level data.
Plans by Type
Breakdown of plans across Finding Mitigation, Survey Templates, Engagements, and System Information types.
Bar chart comparing workload plans by management category across the platform.
Dive Into
Execution Details
From first steps to final delivery - monitor plan statuses, progress trends, and key indicators in one unified view.
Widget displaying the total number of active projects across all workload plans.
Total Projects
Shows the total number of active projects across all plans.
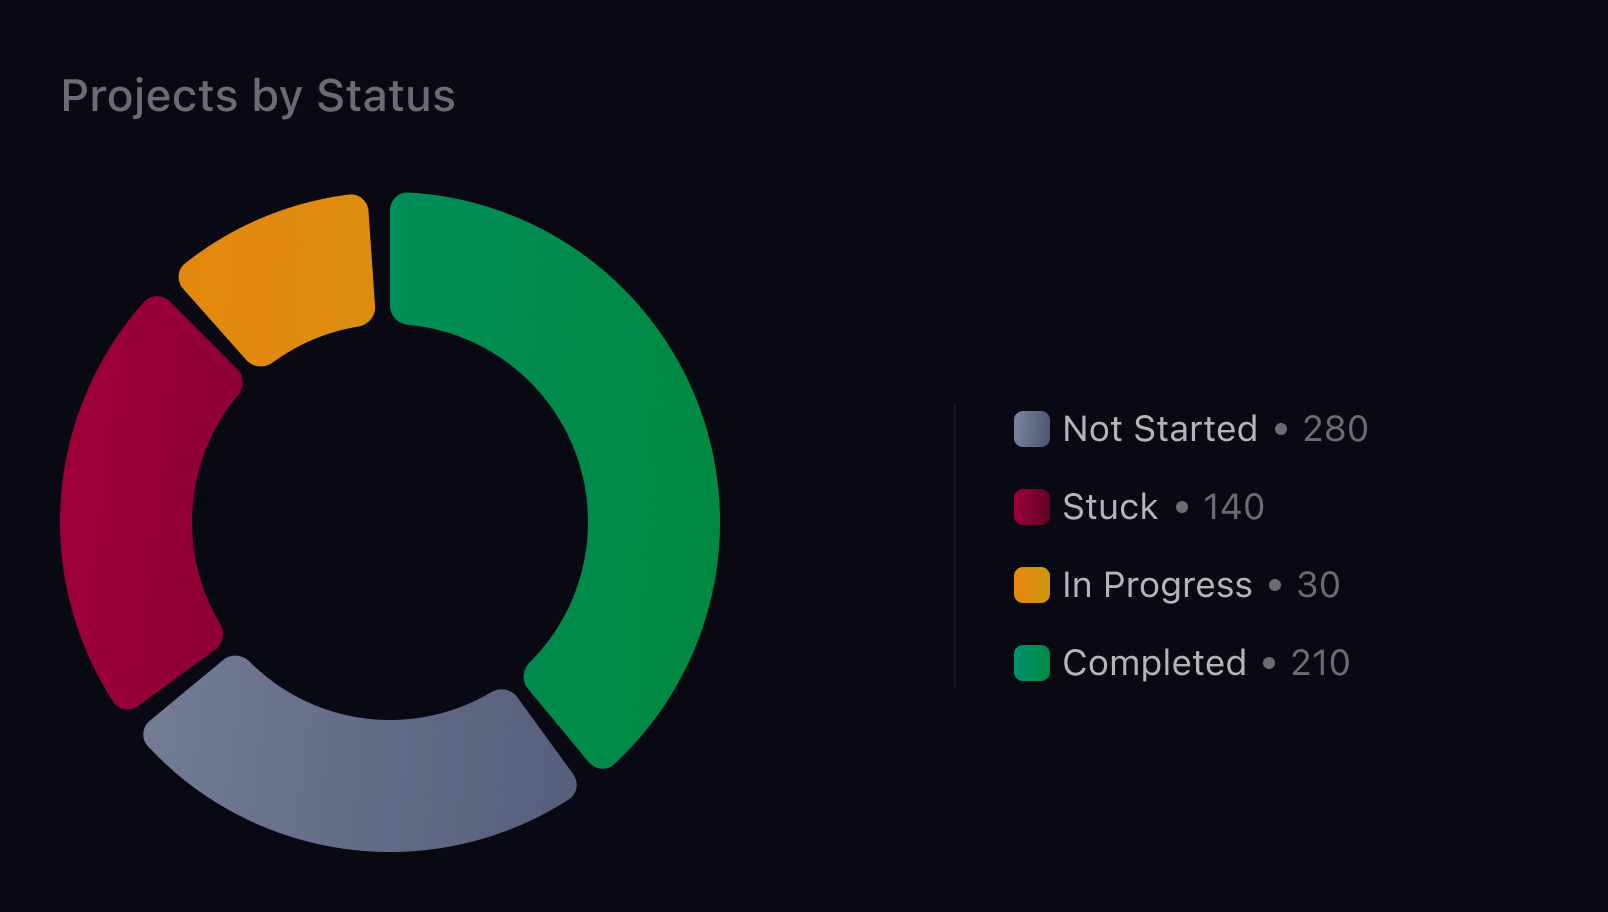
Donut chart showing project distribution by status including completed, in progress, stuck, and not started.
Projects by Status
See the status breakdown of all active plans - from those in progress to stuck or completed - to identify bottlenecks and take action early.
Stay Ahead of Delays and Bottlenecks
A clear overview of deadlines, workload, and recurring blockers - so you can resolve issues before they grow.
Plans at Risk of Missed Deadlines
Highlights plans approaching or exceeding key milestones.
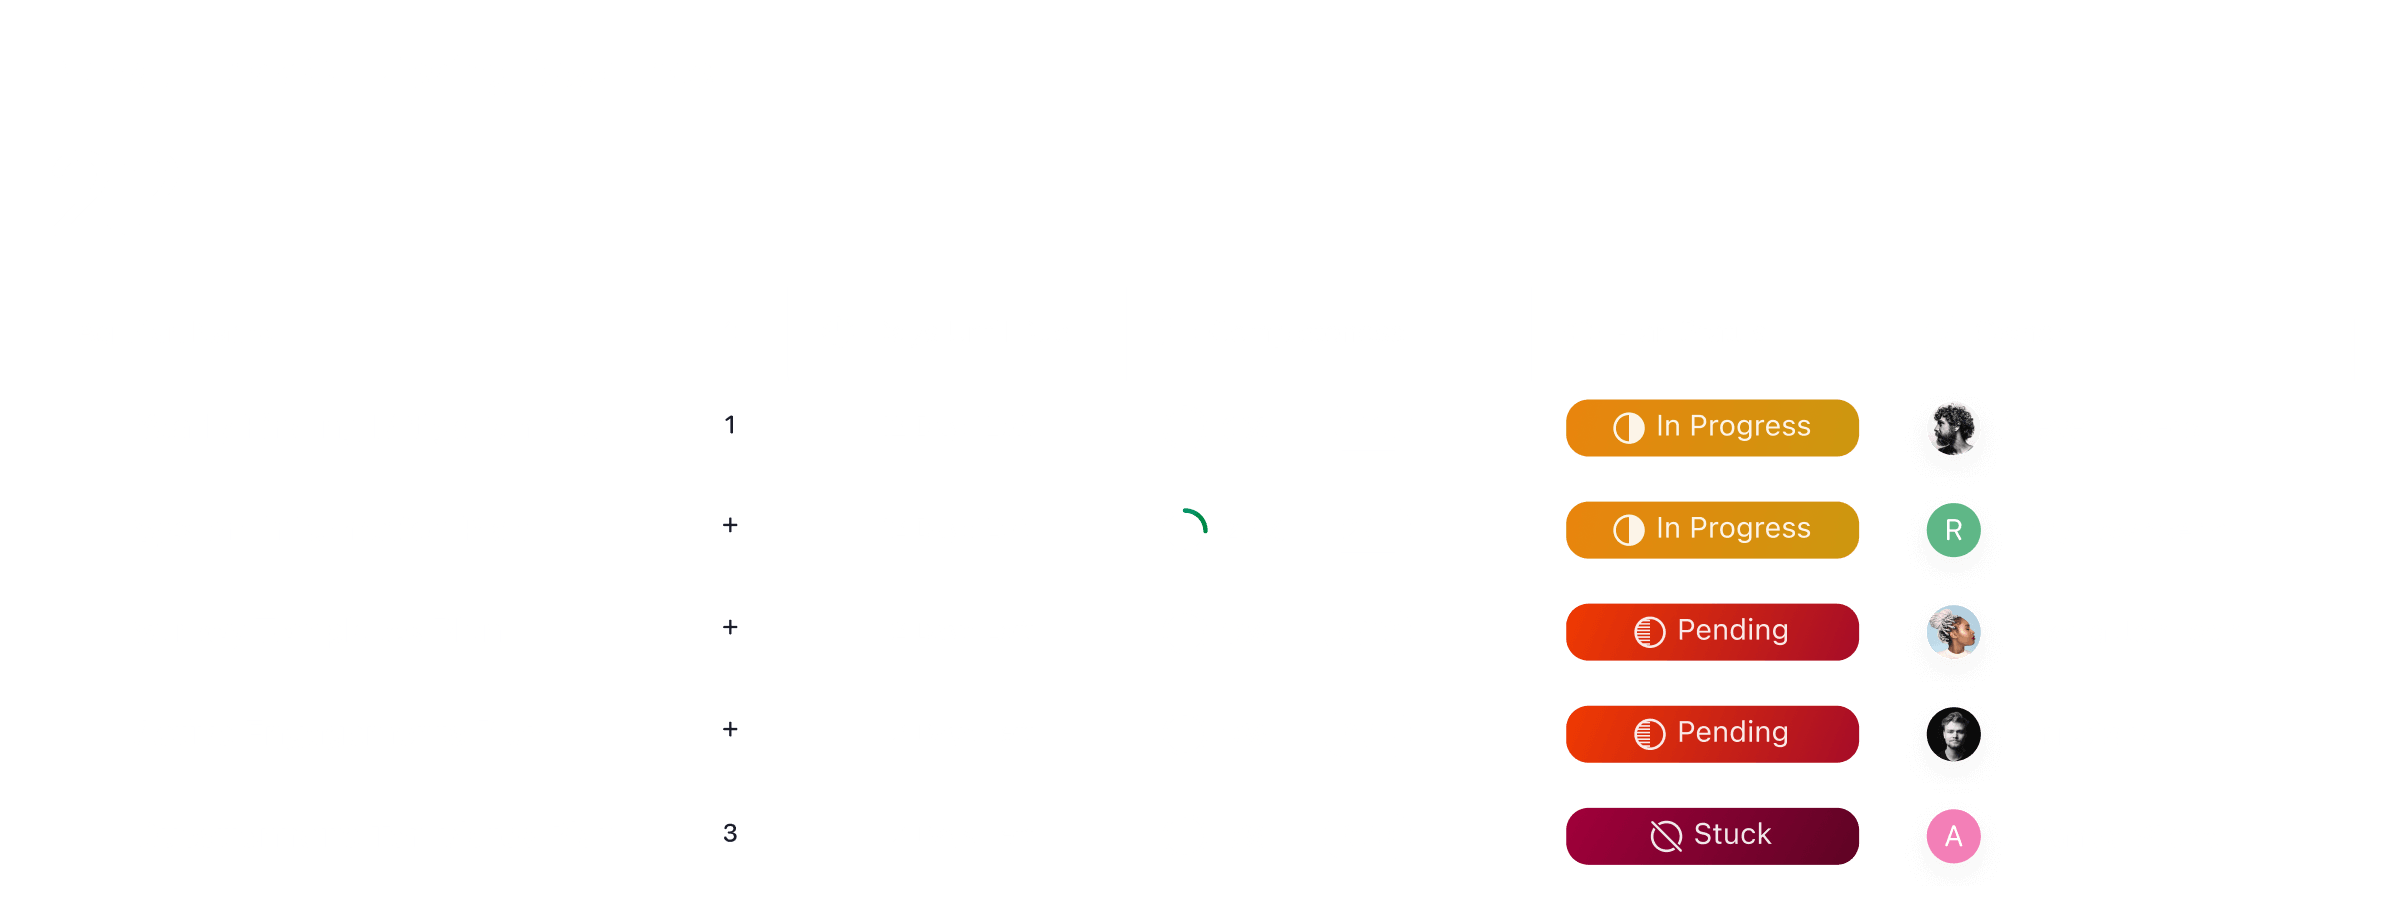
Table highlighting workload plans at risk of missing deadlines with progress and ownership details.
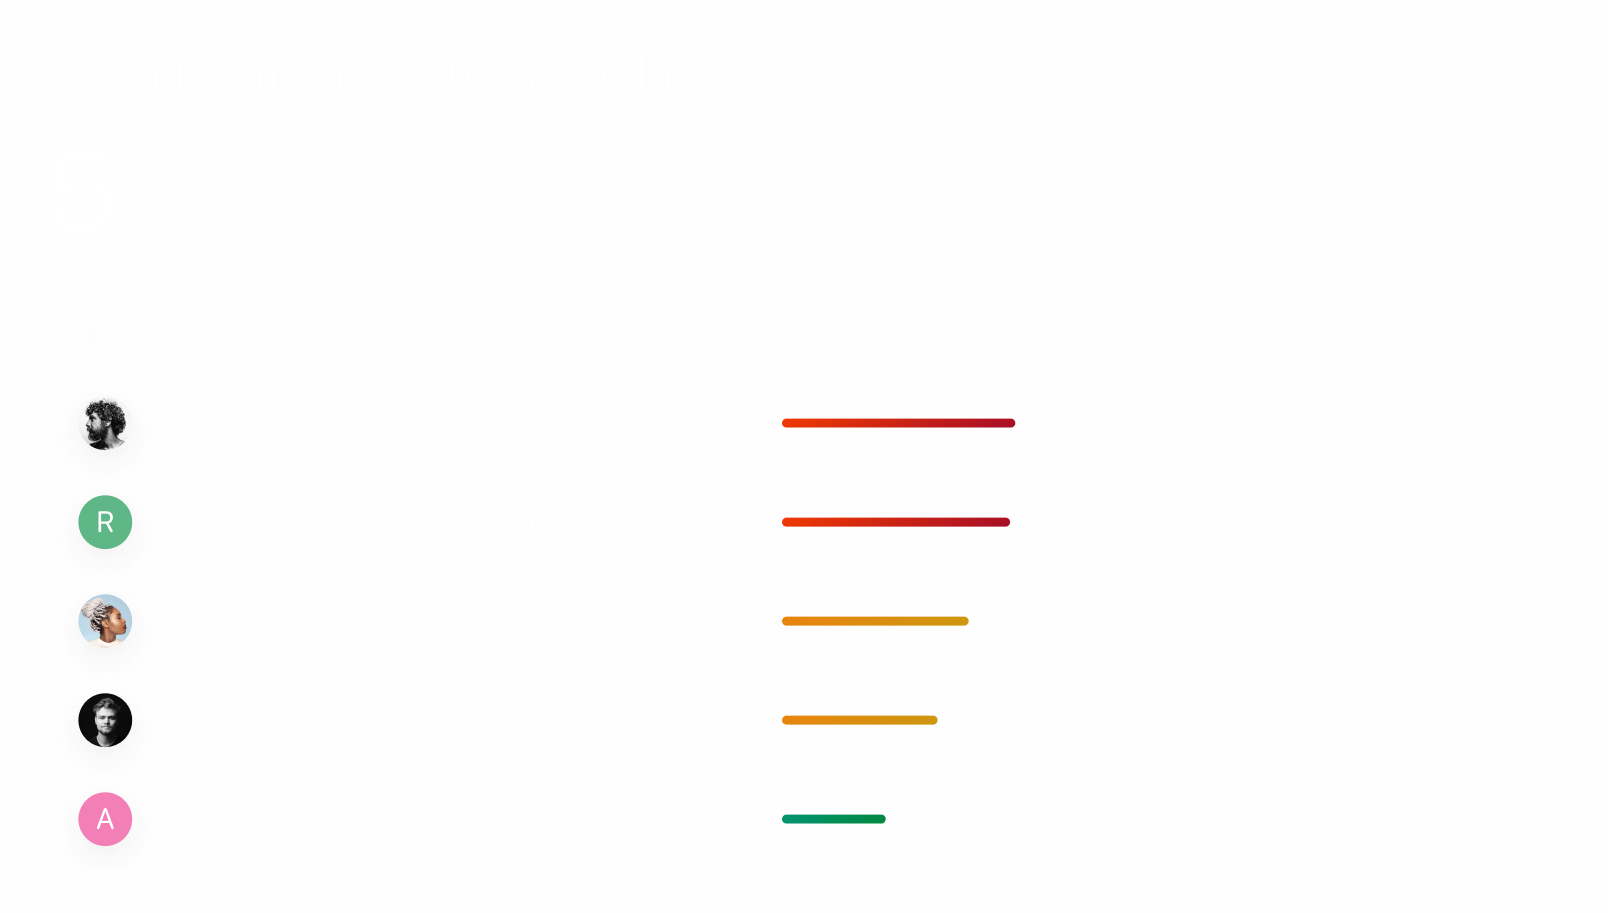
Dashboard identifying team members contributing to project delays and overdue workload.
Team Members Causing Delays
Understand which team members are linked to overdue tasks or missed deadlines, and use the data to optimize future assignments.
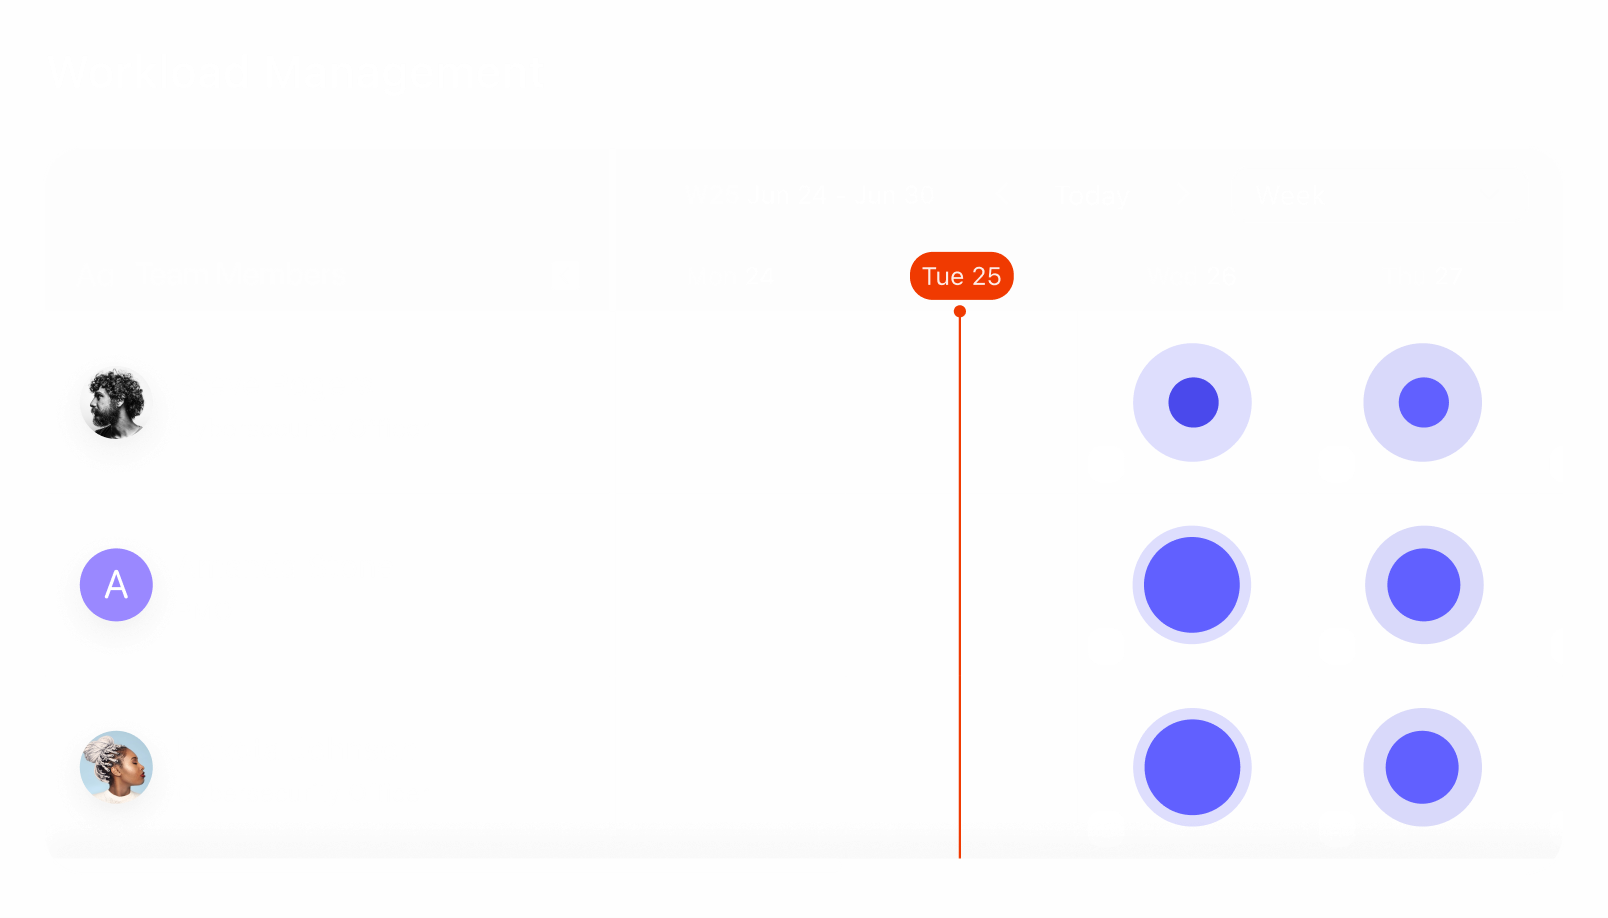
Team workload heatmap showing resource allocation, capacity, and scheduling across team members.
Workload Management
Visualize team members’ workload distribution over time to balance tasks and optimize resource allocation.
Ready to Take 
Control of Risk?
See how AI-driven workload tracking and planning helps your team cut delays and execute with confidence.