


Supplier Management
Metrics
One DashboardEvery Risk Signal
Monitor suppliers, engagements, questionnaires, tickets, and team performance from a unified analytics dashboard.
Book a Demo
Book a Demo
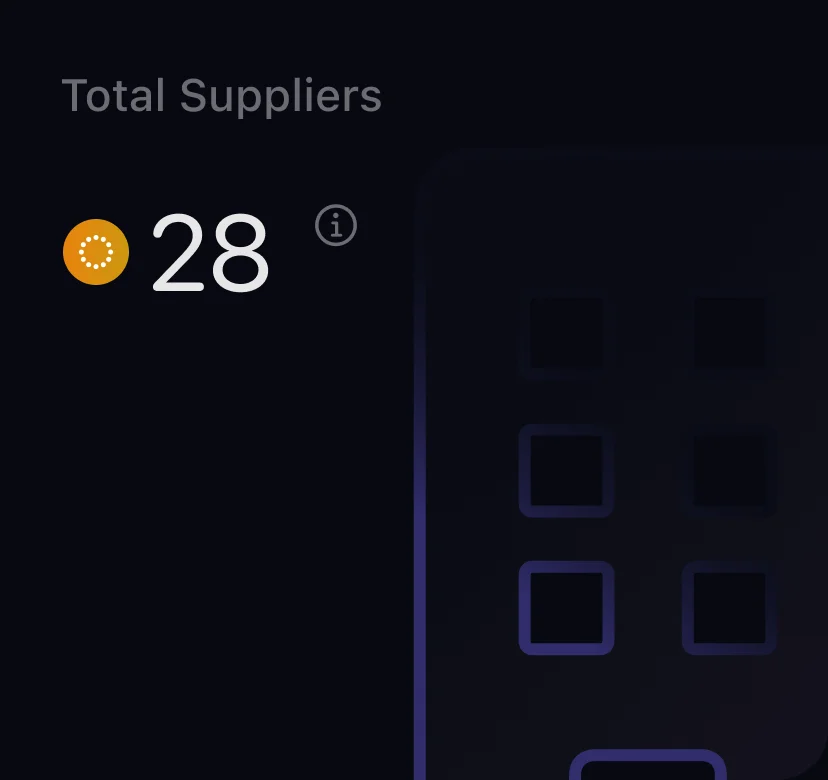
CoreSeenity Supplier Management metric showing total suppliers
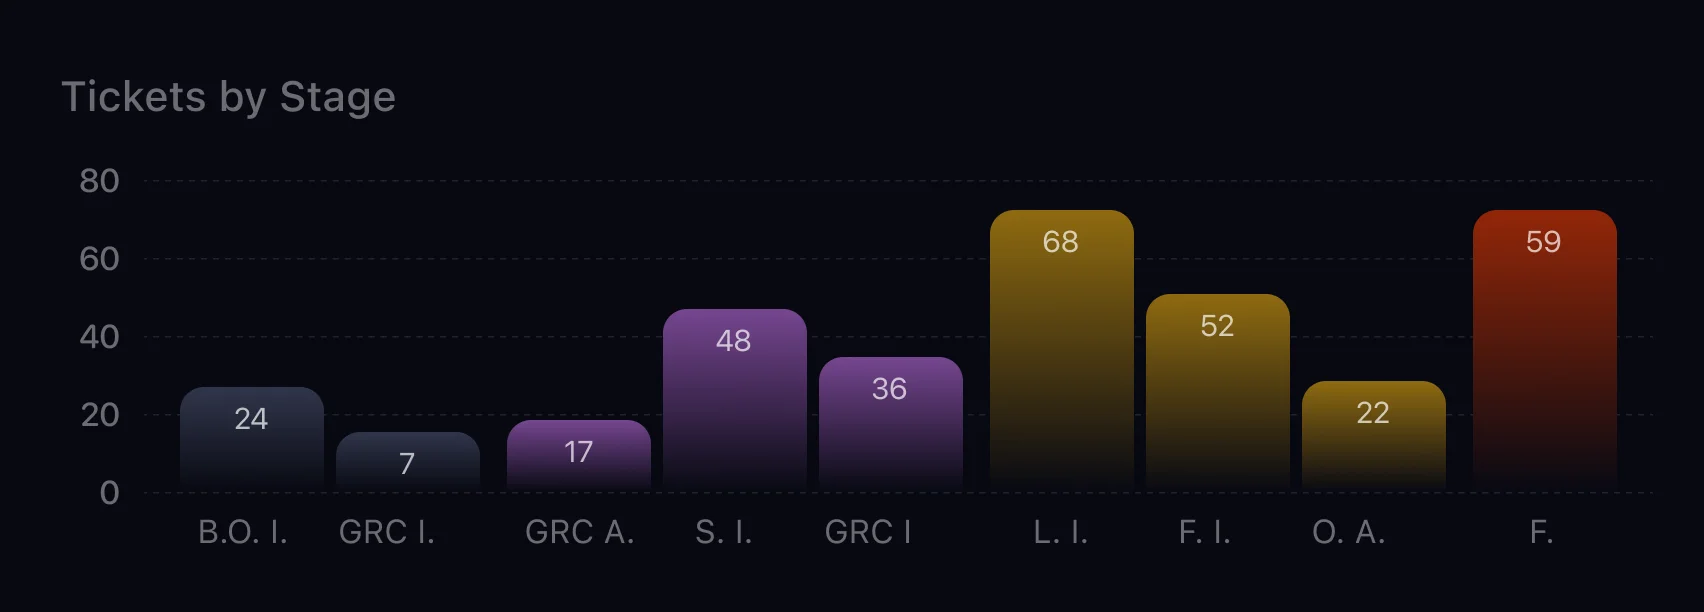
CoreSeenity Supplier Management chart of tickets by stage
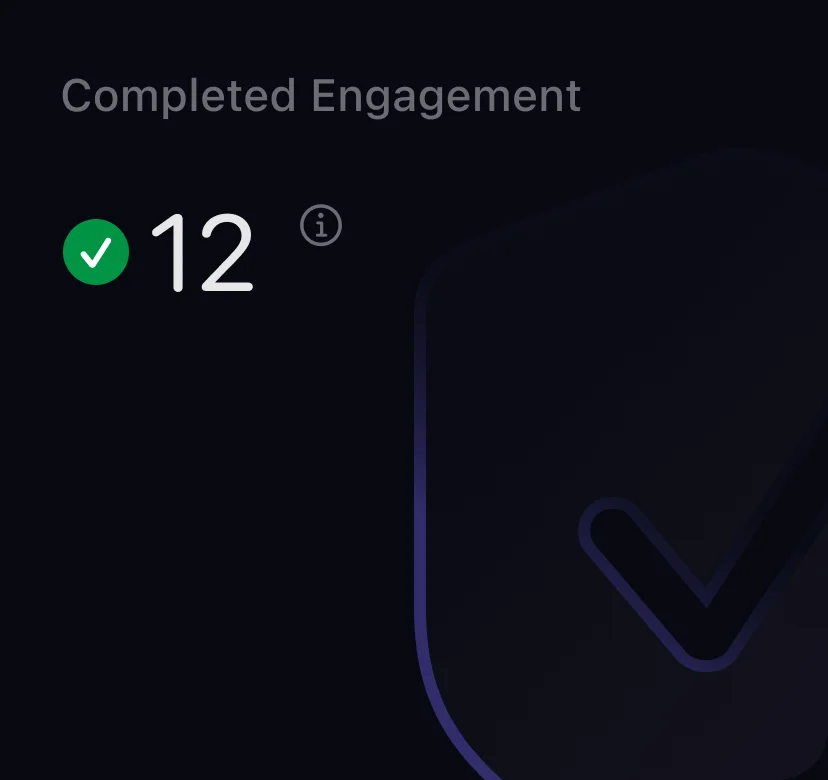
CoreSeenity Supplier Management metric showing completed engagements
Track Supplier Tickets
in Real Time
Identify active tickets, monitor workflow status, and prioritize critical issues before they impact your operations.
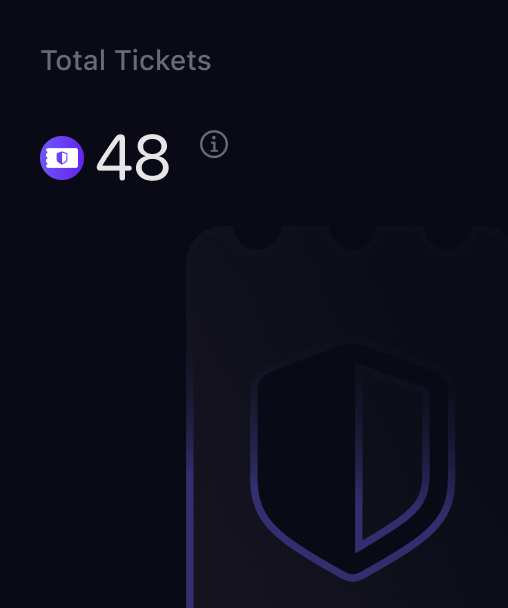
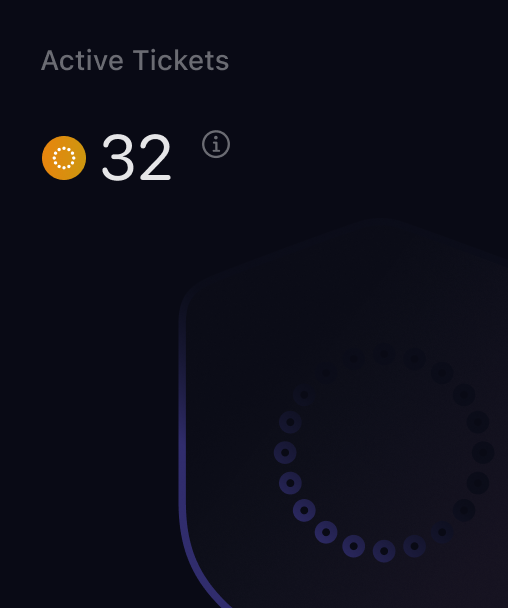
Dashboard cards displaying the total number of security tickets and currently active tickets requiring review or remediation across the organization.
Active Tickets
Total Active Tickets
View the total number of open and active security tickets across your organization.
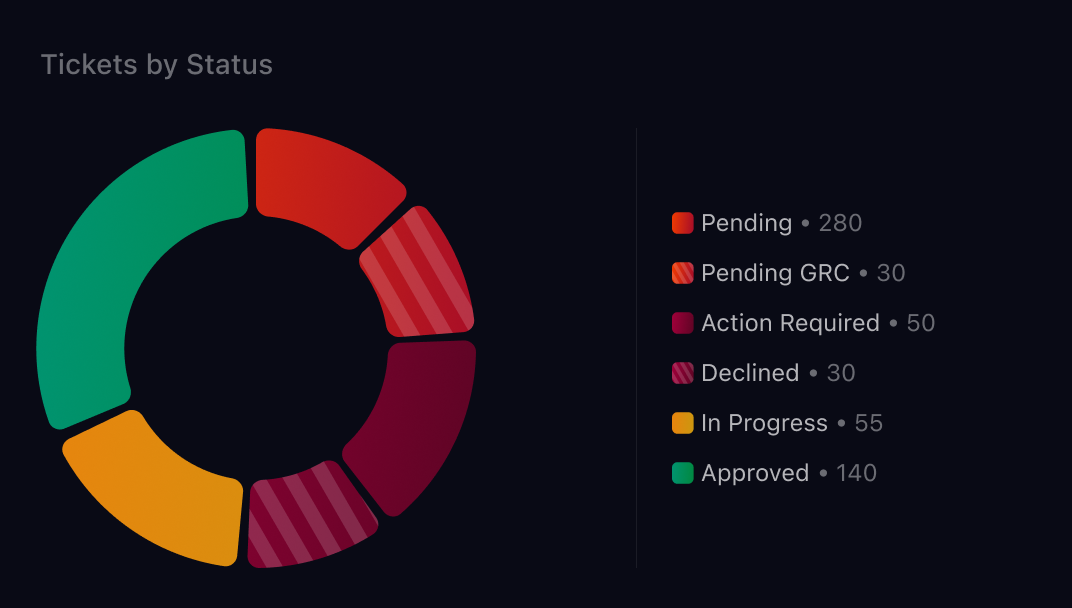
Donut chart illustrating ticket distribution by workflow status, including Pending, Pending GRC, Action Required, Declined, In Progress, and Approved.
Tickets by Status
See how tickets move through each review stage to spot bottlenecks and speed supplier approvals.
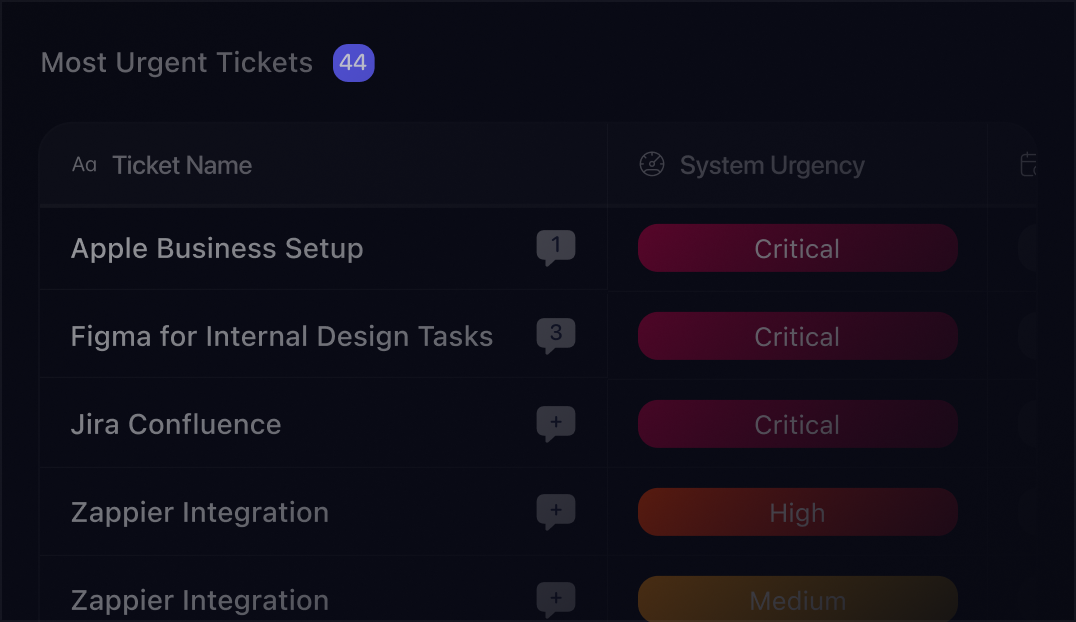
Most Urgent Tickets
Prioritize the most critical tickets requiring immediate
investigation and remediation.
Table listing the highest-priority security tickets with urgency levels, helping teams identify issues that require immediate investigation and remediation.
Analyze Supplier Risk Across Your Ecosystem
Compare supplier impact, business criticality, and security posture to prioritize vendor assessments.
Table comparing suppliers based on their assigned business impact scores, allowing organizations to prioritize security and compliance efforts.
Suppliers by Business Impact
Compare suppliers based on business impact to prioritize security and compliance efforts.
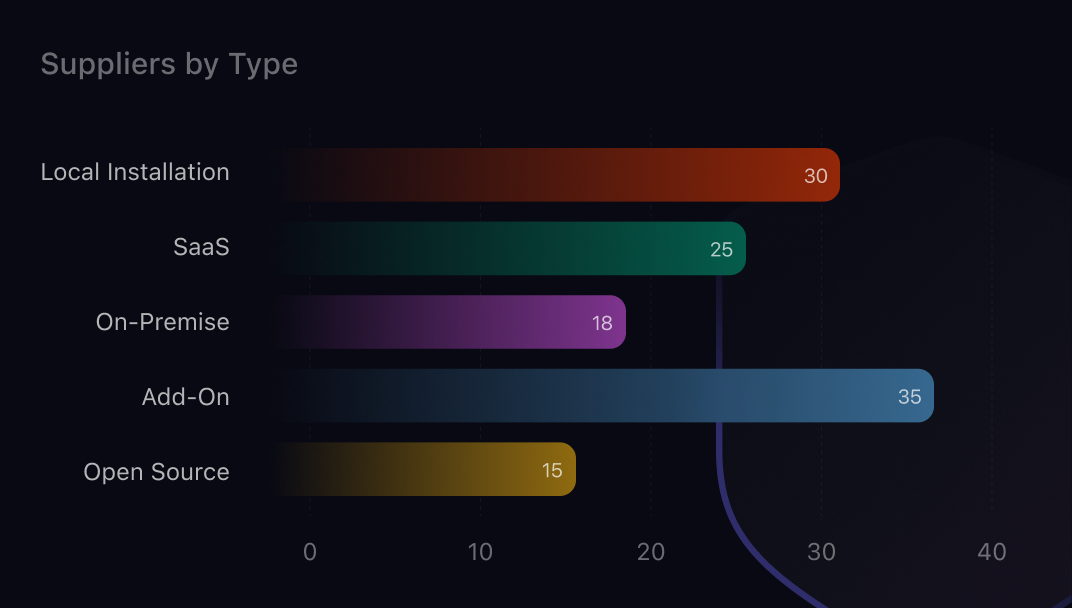
Horizontal bar chart showing supplier distribution across deployment and service categories, including Local Installation, SaaS, On-Premise, Add-On, and Open Source.
Suppliers by Type
Visualize supplier distribution across different service and deployment categories.
Measure Engagement Progress at a Glance
Track assessment completion, engagement status, and workload distribution across all active security engagements.
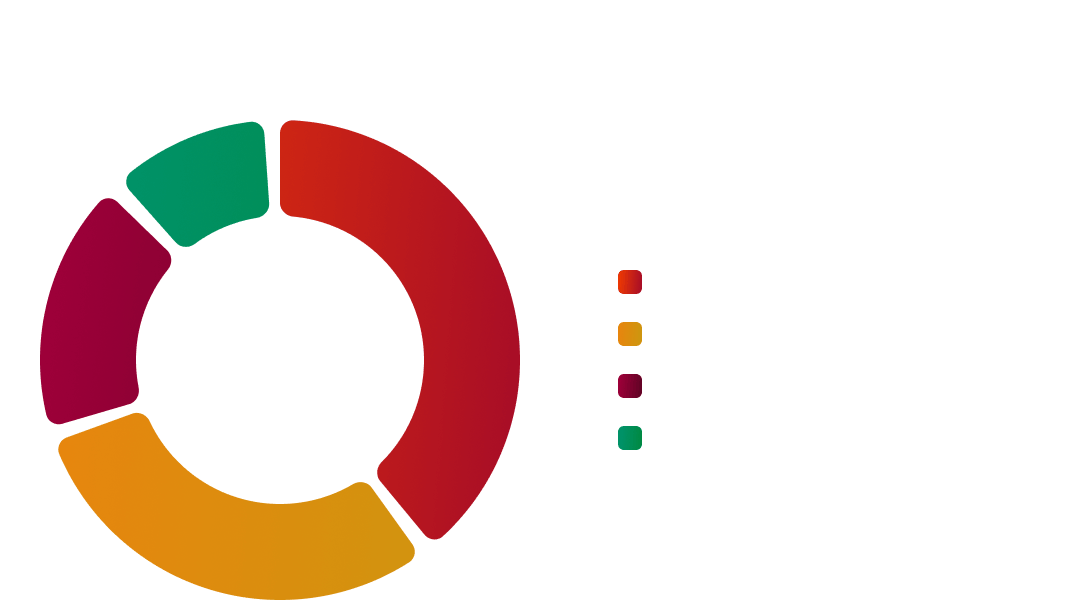
Donut chart displaying the distribution of security engagements by status, including Pending, In Progress, Stuck, and Completed.
Engagements by Status
Track the progress of every engagement across pending, in progress, stuck, and completed stages.
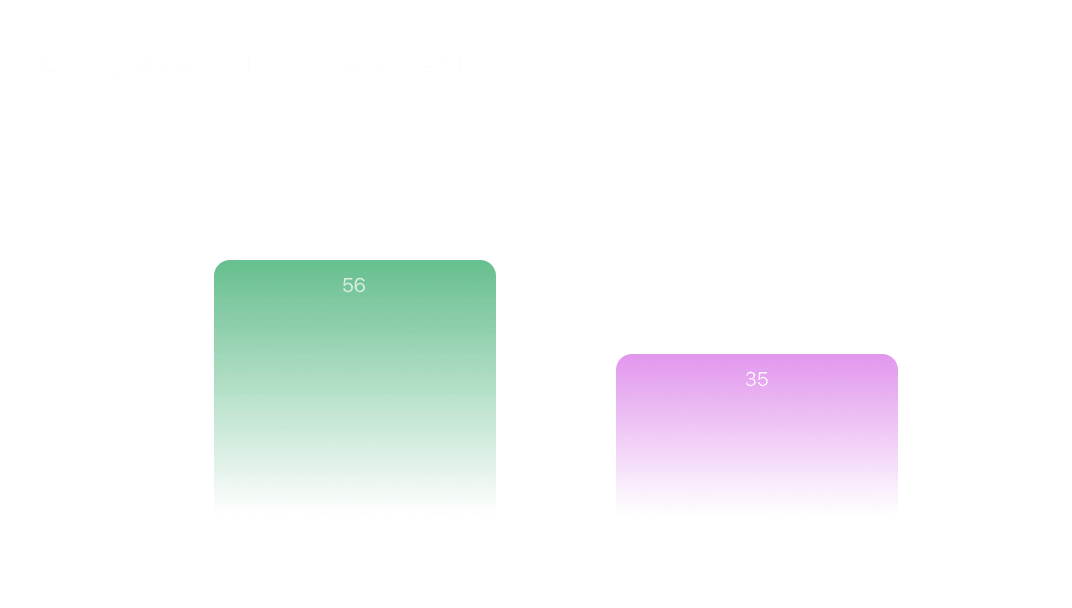
Bar chart comparing the number of engagements by assessment type, including Security Questionnaire Assessments and Vulnerability Assessments.
Engagements by Assessment
Compare engagement volume across assessment types to understand operational focus.
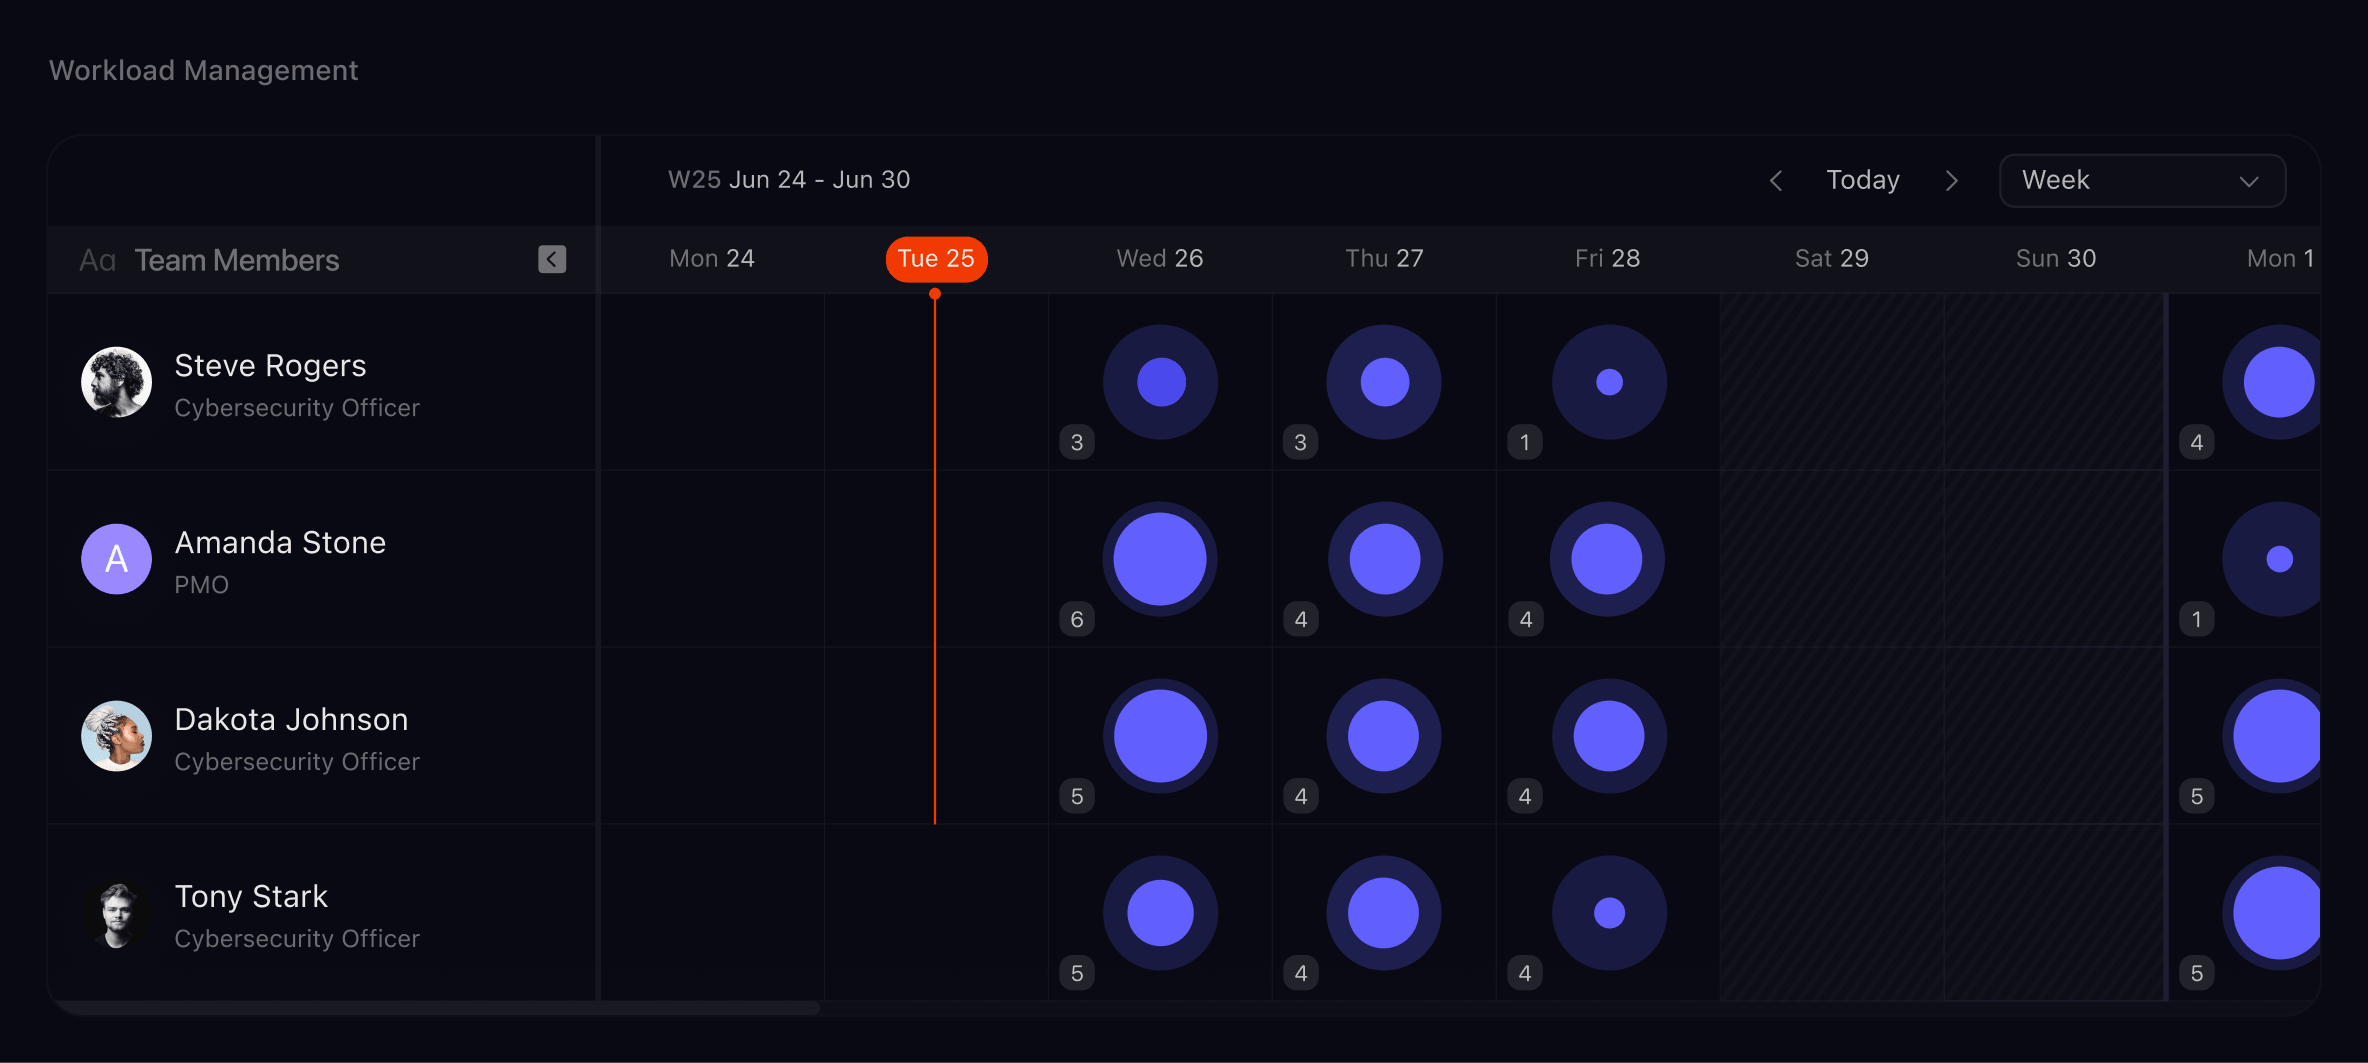
Optimize Capacity with Smart Planning
Balance workloads, identify resource gaps, and keep every engagement moving on schedule.
Interactive workload management calendar displaying team member schedules, task allocation, workload distribution, and resource availability across weekly planning.
Ready to Take 
Control of Risk?
Talk to our experts and see how AI-driven supplier management cuts your third-party risk.