

Risk Assessment
Metrics
AI-Driven Risk & InsightsDashboard
Real-time metrics on risk posture, system exposure, survey activity, and assessment progress - all in one dashboard.
Book a Demo
Book a Demo
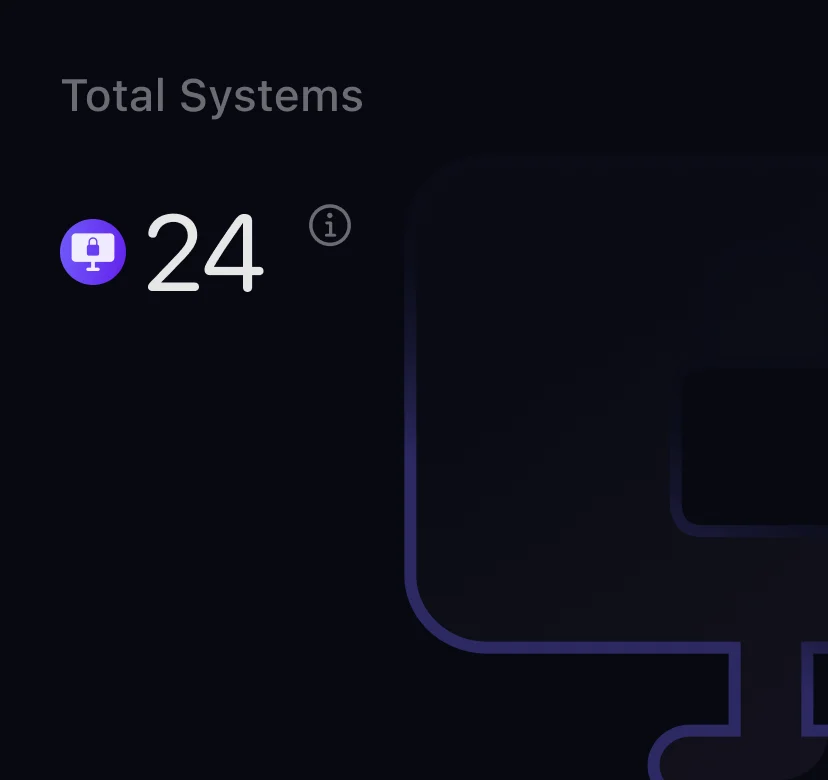
CoreSeenity Risk Assessment metric showing the total number of systems
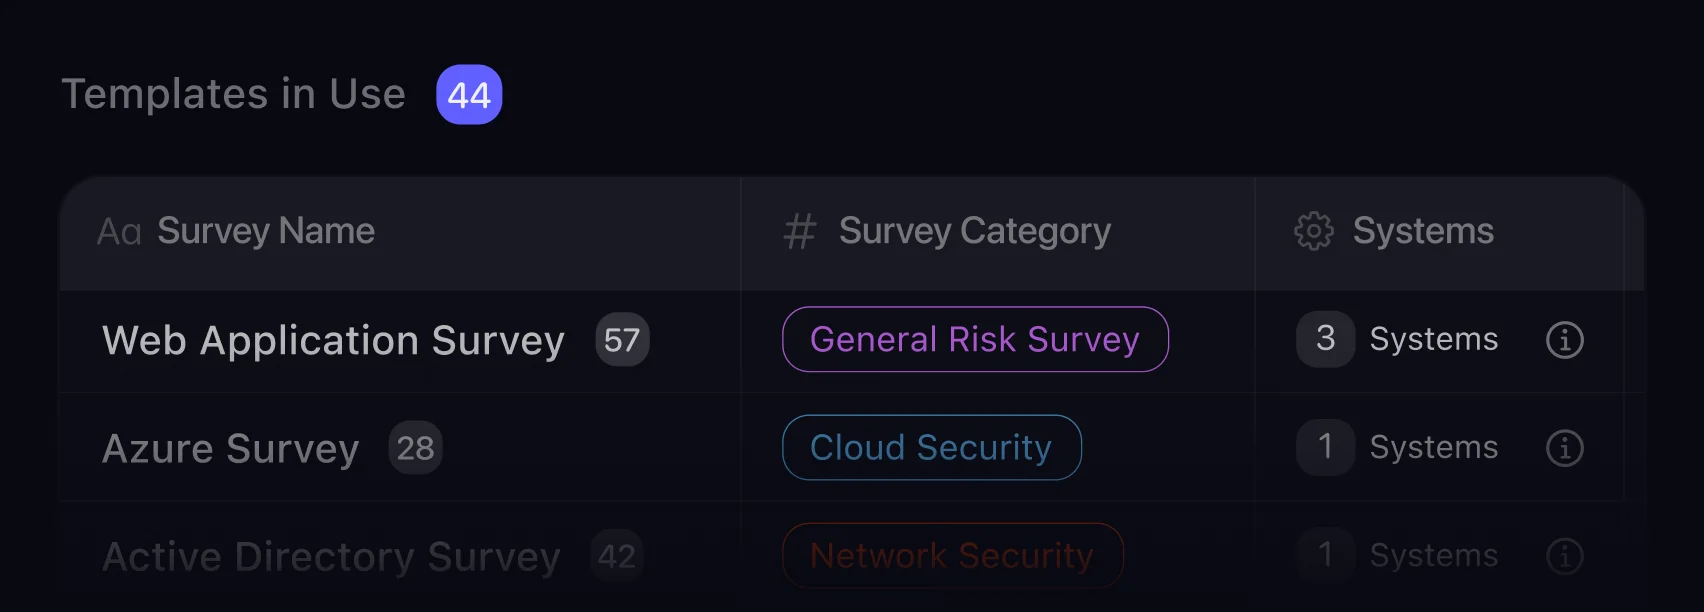
CoreSeenity Risk Assessment table showing survey templates in use by category and system
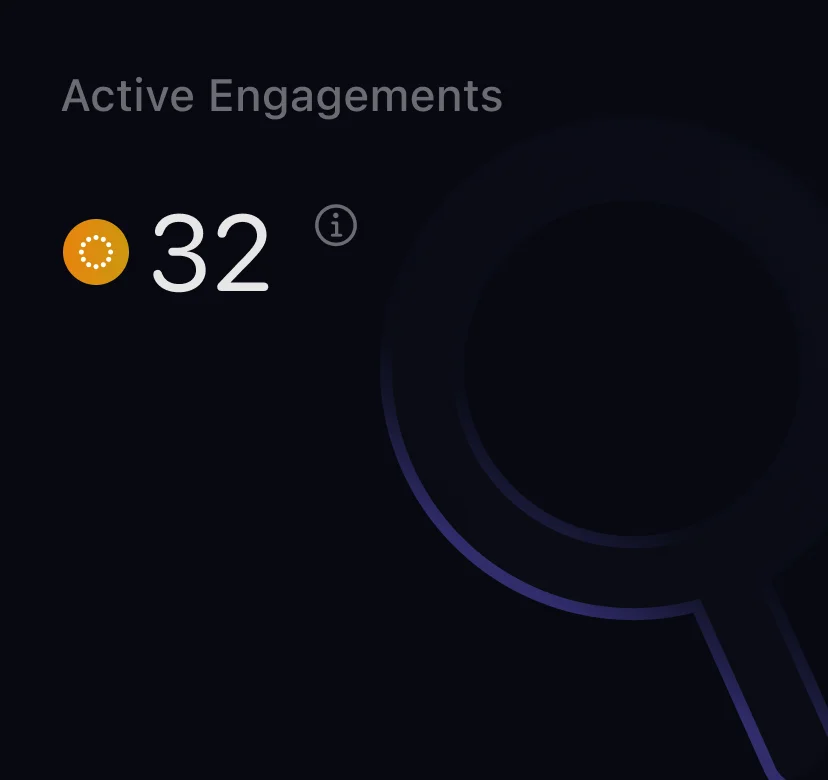
CoreSeenity Risk Assessment metric showing the total number of active engagements
Stay on Top of 
Survey Templates
Monitor template availability, publication status, category coverage, and system-specific recommendations from one dashboard.
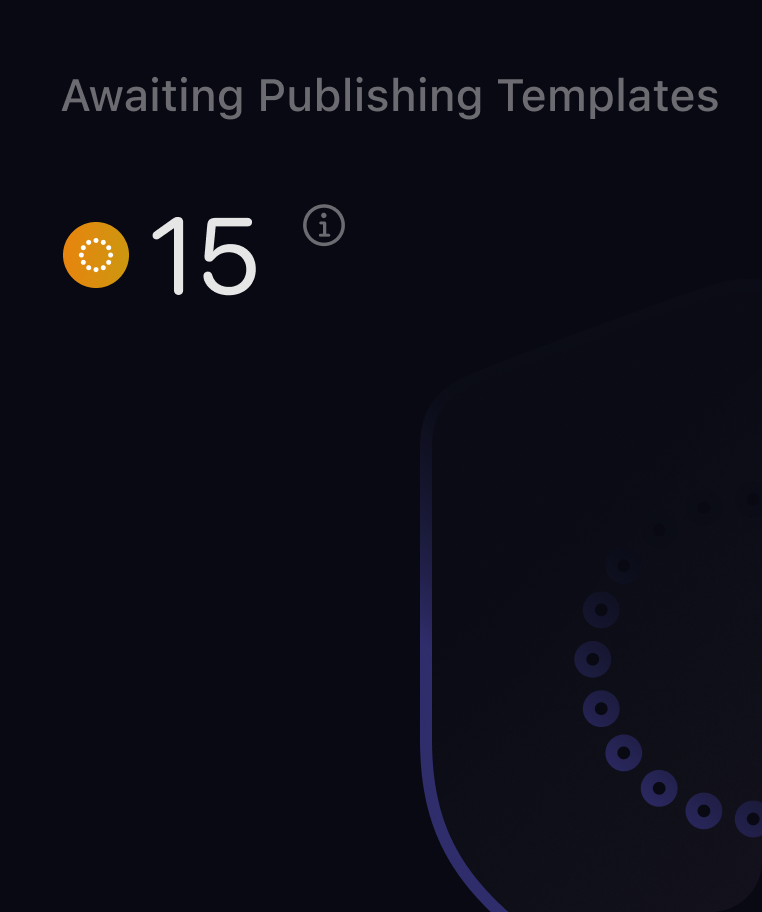
CoreSeenity Risk Assessment metric showing survey templates awaiting publication
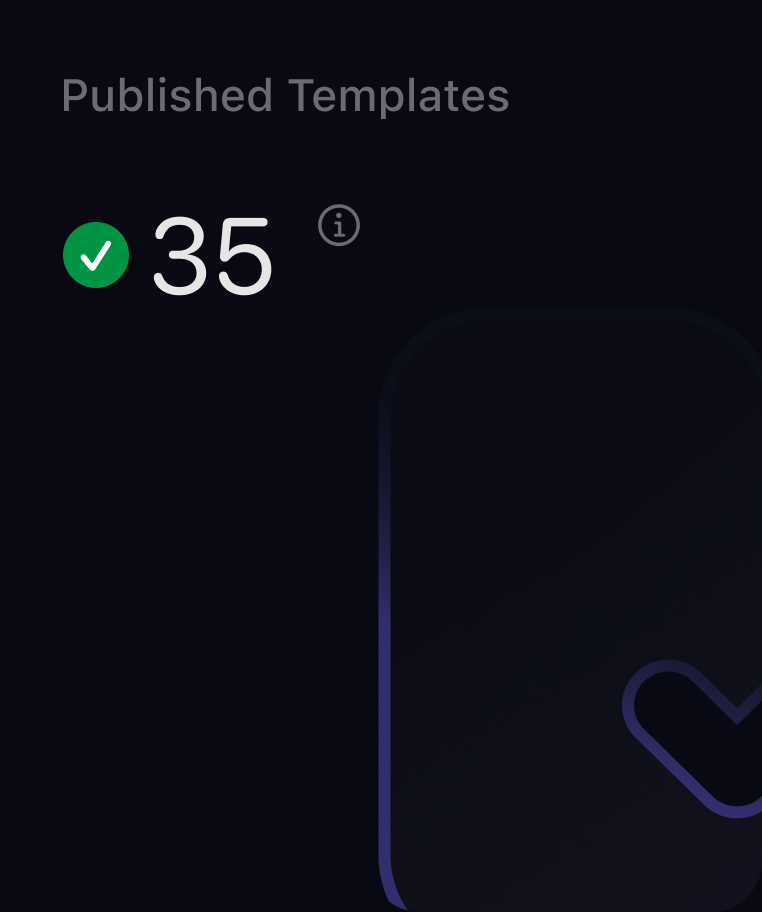
CoreSeenity Risk Assessment metric showing published survey templates
Total Active Survey Templates
Shows how many templates are published and ready to use, and how many are awaiting publication.
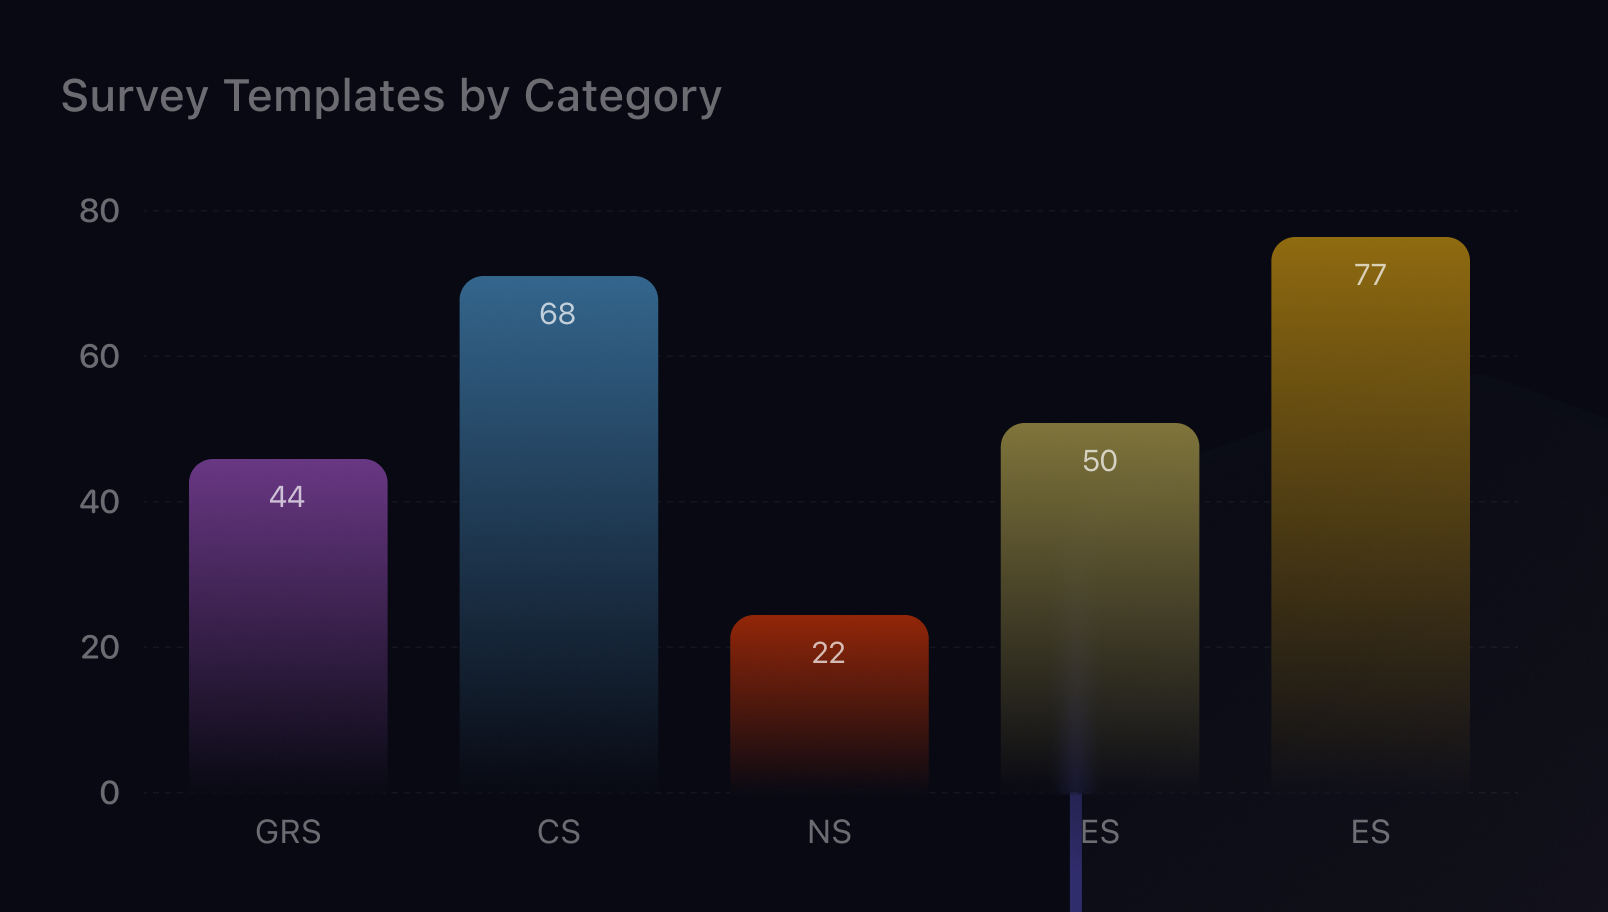
CoreSeenity Risk Assessment chart showing survey templates by security category
Survey Templates by Category
Shows how templates are distributed across security categories to highlight coverage gaps.
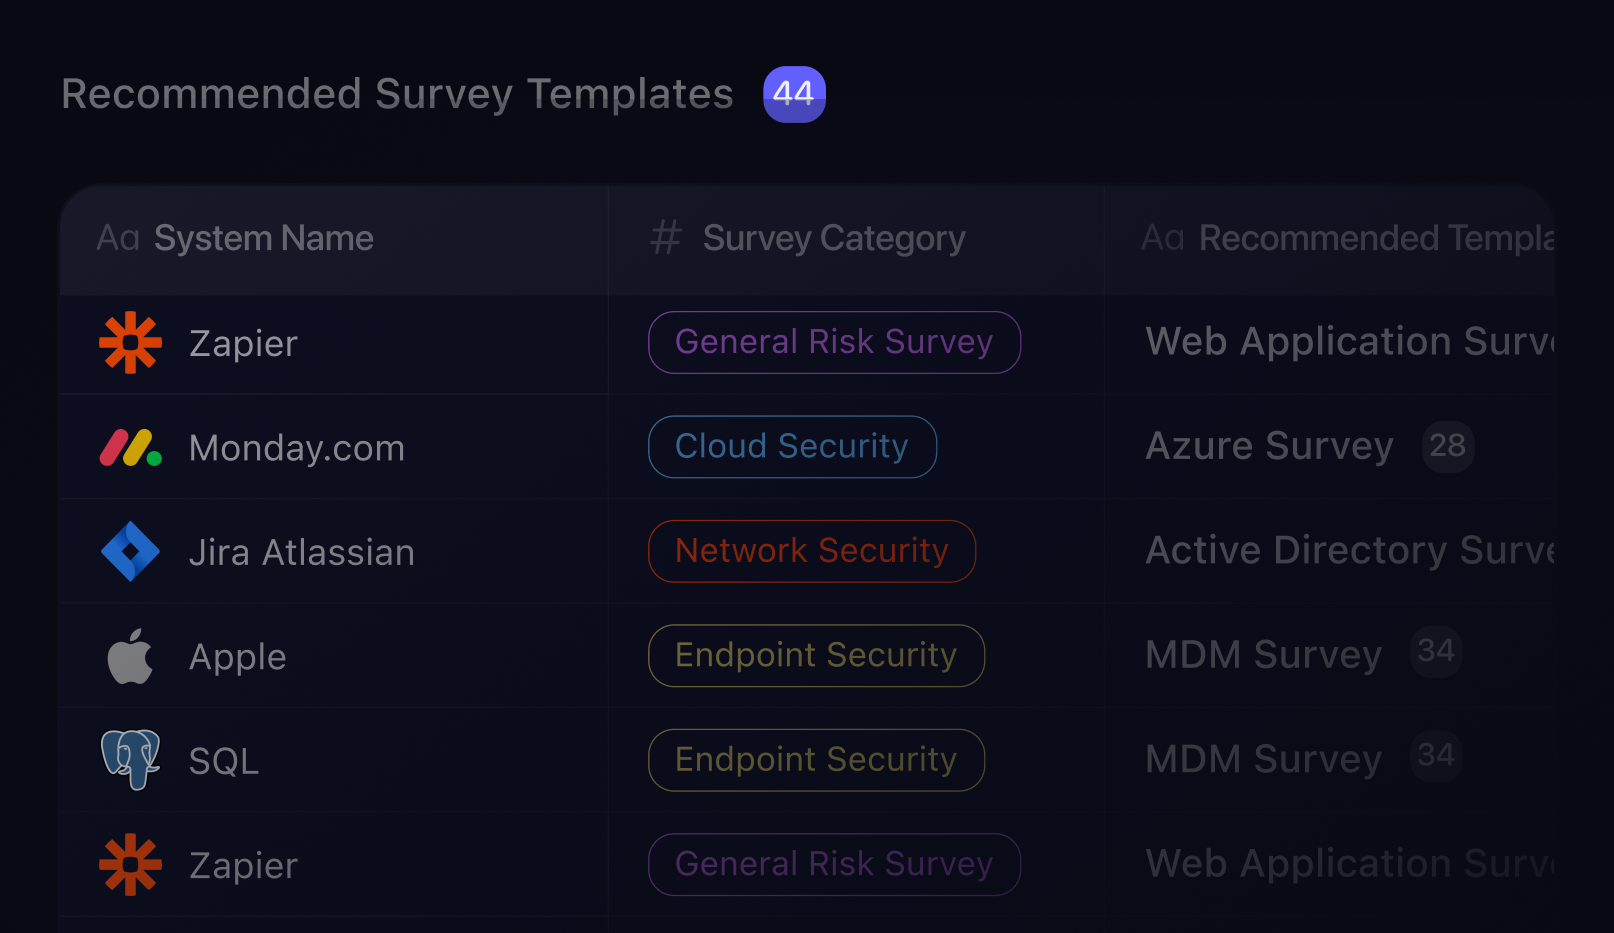
Recommended Survey Templates
Suggests the most relevant templates for each system based on its category and assessment needs.
CoreSeenity recommended survey templates by system and security category
Get Complete Visibility 
into Your Systems
Monitor the health, classification, and environment of your systems - and quickly identify the most vulnerable ones to stay ahead of threats.
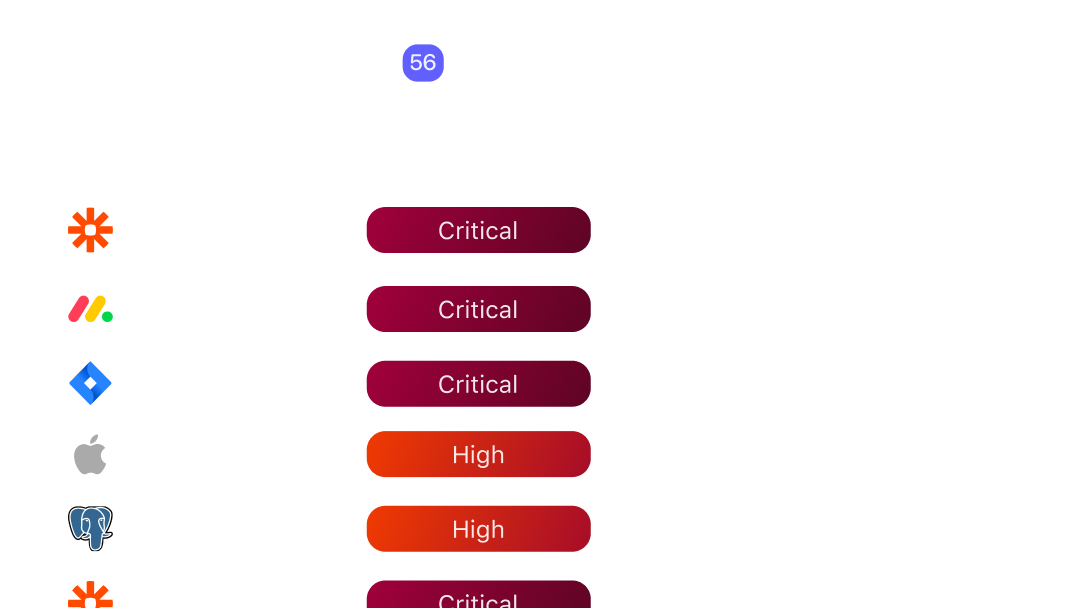
CoreSeenity Risk Assessment list of systems with the highest risk classification
Most Vulnerable Systems
Lists systems with the highest risk classification based on severity and score.
CoreSeenity Risk Assessment chart showing findings with at-risk and delayed deadlines
Finding Deadlines at Risk
Highlights findings within systems that are approaching or have missed resolution deadlines.
Monitor Engagements in Real Time
A clear snapshot of how your survey engagements are progressing and any pending findings that need your attention to keep risk management on track.
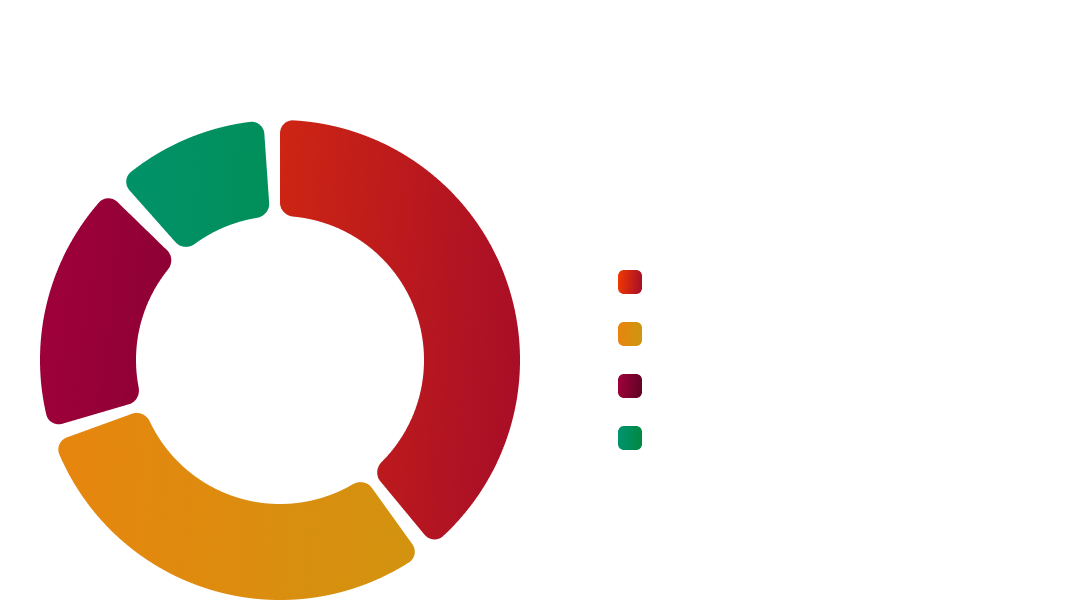
CoreSeenity Risk Assessment chart showing survey engagements by current status
Engagements by Status
Shows the breakdown of all active survey engagements by their current progress stage - pending, in progress, stuck, or completed.
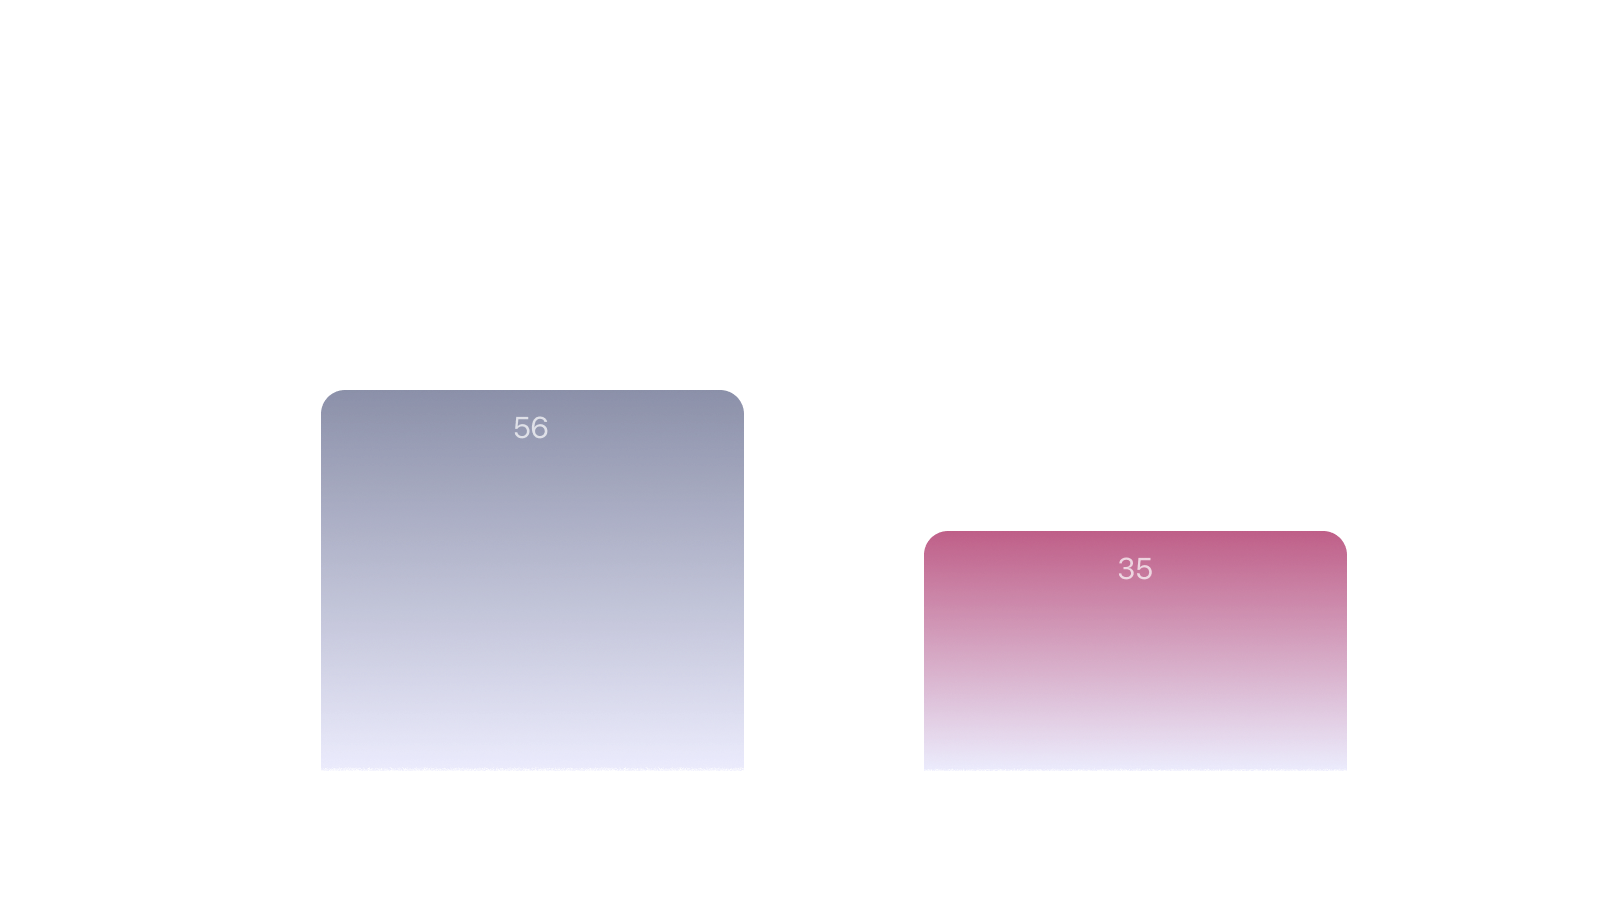
CoreSeenity Risk Assessment chart showing unpublished findings and findings requiring attention
Pending Findings from Engagements
Highlights completed engagements with unpublished or pending findings.
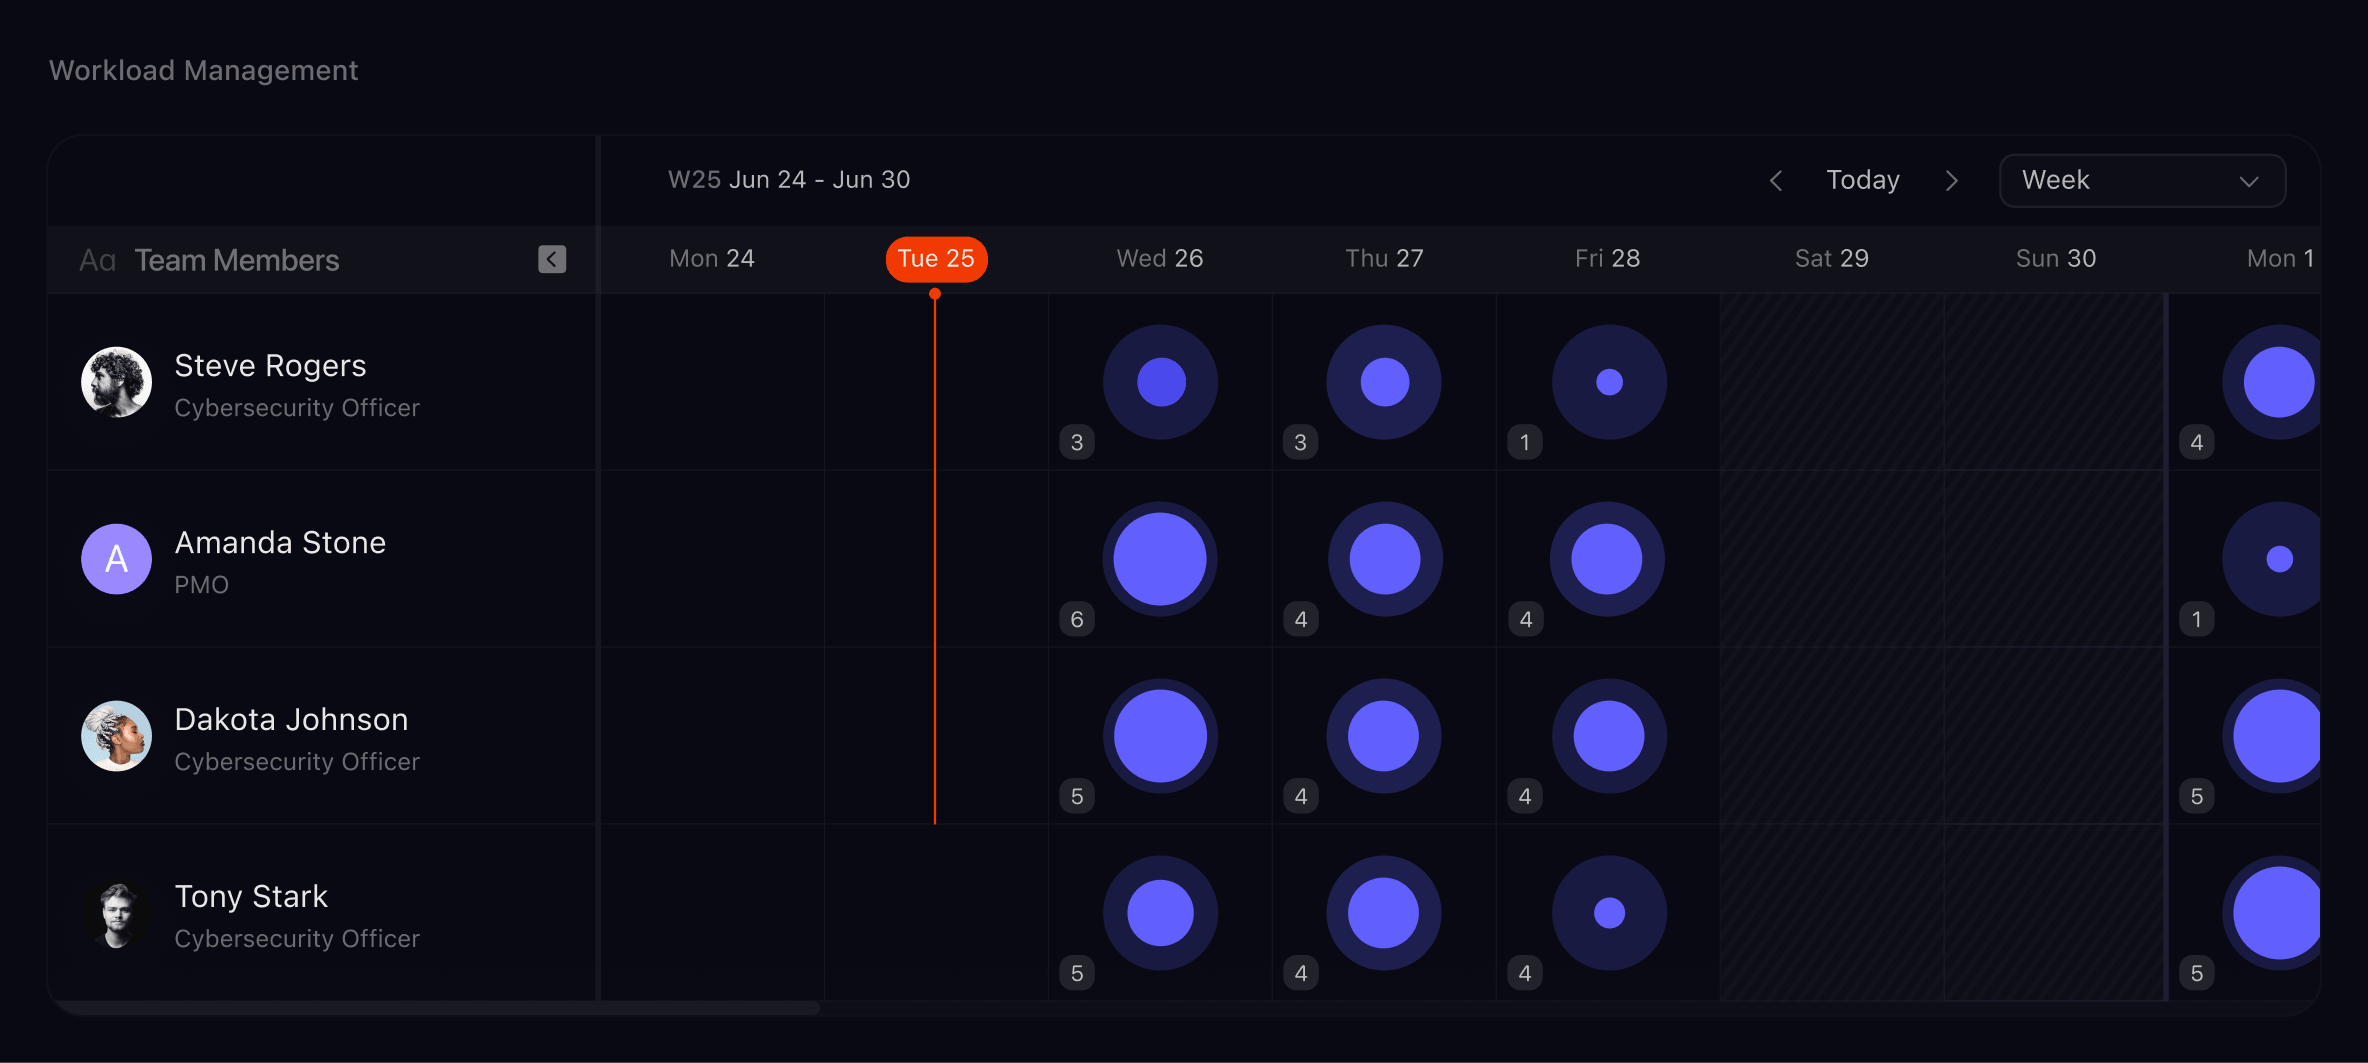
Balance Your Team’s Workload Smartly
Visualizes each team member’s workload over time to support balanced task assignment and optimal resource allocation.
CoreSeenity Risk Assessment workload view with team capacity and task distribution by day
Ready to Take 
Control of Risk?
Talk to our experts and see how agentic AI makes risk assessment faster and audit-ready.